In this article, we will share a method on how you can bold and underline text in your DAX measures in Power BI.
It involves using HTML code in your DAX measure, which enables underlining, bolding, italics and more.
Install HTML Content visual
The first step you need to take to bold and underline text in your Power BI measure is to install a new visual.
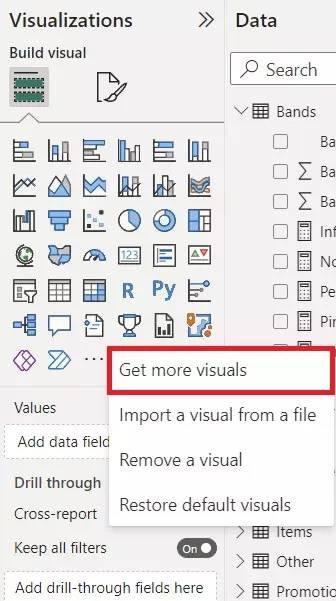
To do this, open the Visualizations pane and click on the elipsis and then ‘Get more visuals’. As below:

Next, search for the visual ‘HTML Content’, which looks like this:

Download this visual to your Power BI report.
This visual allows us to use HTML in our measures. HTML can be used to underline and bold text.
Create HTML DAX Measure
Now we need to create a measure to use in our HTML Content visual.
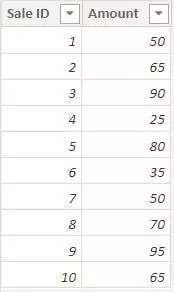
Here is an example table we have created with Sales data.
It has two columns: the Sale ID and Amount. See below.

We have created a new measure to sum the Amount column and called this Total Sales. We will use this in the following measure.
To underline text you can use <u> and to bold text use <b>. Combine this with text using quotations and ampersand symbols to create any text you want with underlining and bolding.
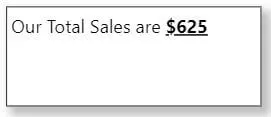
Here is an example measure to display “Our Total Sales are $625“:
Total Sales Text =

 "Our Total Sales are "

 & "<b>"& "<u>"&

 "$"

 &"</b>" &"</u>"

 &

 "<b>"& "<u>"&

 [Total Sales]

 &"</b>" &"</u>"
Result
Here is the result from our DAX measure above.
You can use this as a template for your underlining and bold measures.


Doesn’t work for me. I am using text and measures to display a text. And when I use this method to try and underline a measure (or bold) it just appears as normal text.