
In this article, we will show you two methods of how to sum multiple columns in Power BI.
The first method uses a calculated column and the second method uses DAX functions.
We will also cover common questions such as incorporating filters or combining columns from different tables in Power BI.
How to sum multiple columns in Power BI
Here is some example data we will be working with to demonstrate how to add multiple columns using DAX in Power BI.
It shows the number of articles and videos produced by worker and month, and the costs for them both.
We will be adding the number of articles and videos together using two different methods.

Calculated column
The first way we can sum the articles and videos columns is to use a calculated column.
Firstly, navigate to your table and then select ‘Table tools’ from the top ribbon.
Next click ‘New Column’ as shown below.

Then you can create a new column that adds your desired columns together.
In this example, here is our calculated column code:
SUM of Articles and Videos =

'Work'[Articles] + 'Work'[Videos]
Here is the result we got:
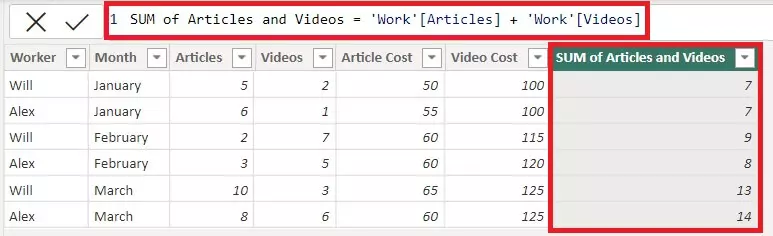
This has added the Articles and Videos columns together and given us a new column with the result.
SUM or SUMX
If you don’t want to add a new column to your table, you can also create a measure and use this in any visuals on your Power BI report.
To do this, select ‘New measure’ from the top ribbon in Power BI as shown below:

There are two DAX functions you can use to add multiple columns in Power BI.
The first is SUM. This works the same way as the calculated column and will add together the values you specify.
For our example, here is what our measure would look like using SUM:
SUM Measure =

SUM('Work'[Articles]) + SUM('Work'[Videos])
The other DAX function you can use to sum columns is SUMX.
This is slightly different to the SUM function but works in the same way. We will cover the differences and when you need to use SUMX in the next section.
SUMX requires you to specify the table and then you can choose which columns you want to add together.
For our example, here is what our measure would look like using SUMX:
SUMX Measure =

SUMX('Work','Work'[Articles]+'Work'[Videos])
Here are the results for both measures shown below:

What is the difference between SUM and SUMX in DAX?
It’s important to understand the difference between SUM and SUMX and when you need to use them.
Unlike SUM, SUMX is an iterator and works by going through and calculating each row at a time.
Using our example, we can use SUMX to calculate the total cost of videos and articles. We cannot use SUM because the calculation needs to be performed line by line to work out the cost and then sum it.
Here is the measure we created that calculates the cost for each worker by month:
SUMX Total Measure =

SUMX('Work','Work'[Article Cost]*'Work'[Articles])+SUMX('Work','Work'[Video Cost]*'Work'[Videos])
Here is the result:

How to sum multiple columns with a filter in Power BI
It is possible to sum multiple columns in Power BI with a filter.
The FILTER function in DAX can be nested within SUMX to filter the calculation.
Using our example data, here is how we would use FILTER to add the number of articles and videos in February:
FILTER Measure =

SUMX(FILTER('Work','Work'[Month] = "February"),'Work'[Articles] + 'Work'[Videos])
Another function you can use is CALCULATE.
Use your SUM or SUMX formula in the first part of the function and then you can specify what you want to filter.
Using our example data, here is how we would use CALCULATE to add the number of articles and videos in February:
CALCULATE Measure =

CALCULATE(SUM('Work'[Articles])+SUM('Work'[Videos]),'Work'[Month]="February")
Here are the results of both measures:

To run calculations using the costs, for example, you will need to use SUMX for these calculations as well as CALCULATE or FILTER.
How to sum multiple columns from different tables in Power BI
It is also possible to add multiple columns together from different tables in Power BI.
You can do this by simply using the below syntax:
Measure = SUM(Table1[Column]) + SUM(Table2[Column])Using our example, we have split our original table into two: Work and Costs.
The Work table contains the number of articles and videos produced.

The Costs table contains the costs of each article and video.

We have had to use a key in both table so that a relationship can be created between the two.

The following measure uses the SUMX and RELATED functions to sum the total cost of articles:
Measure =

SUMX('Work','Work'[Articles] * RELATED(Costs[Article Cost]))
Here is the result:
